By: Jorge E. Guerra, Ph.D., Nathan Eichenlaub, Dustin Solomon
TECHNICAL SUMMARY:
- We present an independent definition of event probability of detection (EPOD) for a whole site event based on an aggregate of individual emissions within an event.
- We conduct a logistic regression for detections vs. event aggregated leak rates to find a lower bound on the whole site leak rate for 90% POD as defined above. We find that site emissions lower than 1.0 (kg/hr) or (kg/hr)/(m/s) will be detected at a 90% rate.
- Our definition of EPOD corresponds closely with an operator’s perspective in response to whole site emissions events rather than focusing on individual sources.
- This analysis corresponds to pure event detection from measurements only before invoking any quantification processing. This is how Project Canary’s event detection and alerting software functions for our customers.
Project Canary’s continuous monitoring networks participated in METEC’s annual ADED experiments. Over 81 days of controlled but undisclosed release testing in various configurations and conditions, our sensor array and quantification system functioned continuously and reported a wealth of data. Specific experiments are comprised of 1 to 5 simultaneous undisclosed release locations over a finite period. Participants provided response data back in the form of detections found, their duration, and a profile of source location and emission rates estimate based on a quantification procedure after detection. Using data from these controlled release experiments, we present an independent analysis of event or whole-site detection as the nominal and simplest metric for the performance of our sensing network. Specifically, we analyze detection rates by our sensors over each experiment by considering a single aggregate leak rate for the entire site. Our system performs well for whole site event detection with a 90% probability of alerting on true emissions lower than 1.0 (kg/hr) or (kg/hr)/(m/s).
Event Probability of Detection (EPOD) is defined as the ratio of whole-site event detections to all events detected and not for the entire site. Thus, we do not consider the exact spatial arrangement of sources (localization) or distribution of individual rates (quantification) for an event. EPOD addresses the question: what is the minimum emissions event that our sensing array can reliably detect at a given site?
Project Canary considers true measured event detection and actionable response as the primary source of utility and value to our customers (site operators and response staff). From the operator’s perspective, an emissions event is most important when considering whether and when a remedial response is required. Therefore, we will consider system performance from the whole-site and event point of view that our customers take. Here we define a whole site emissions event as a cluster of point emissions with active variable rates for a finite and detectable amount of time. Furthermore, controlled release experiment blocks are thus considered direct analogs to an actual emissions event as an operator would experience it.
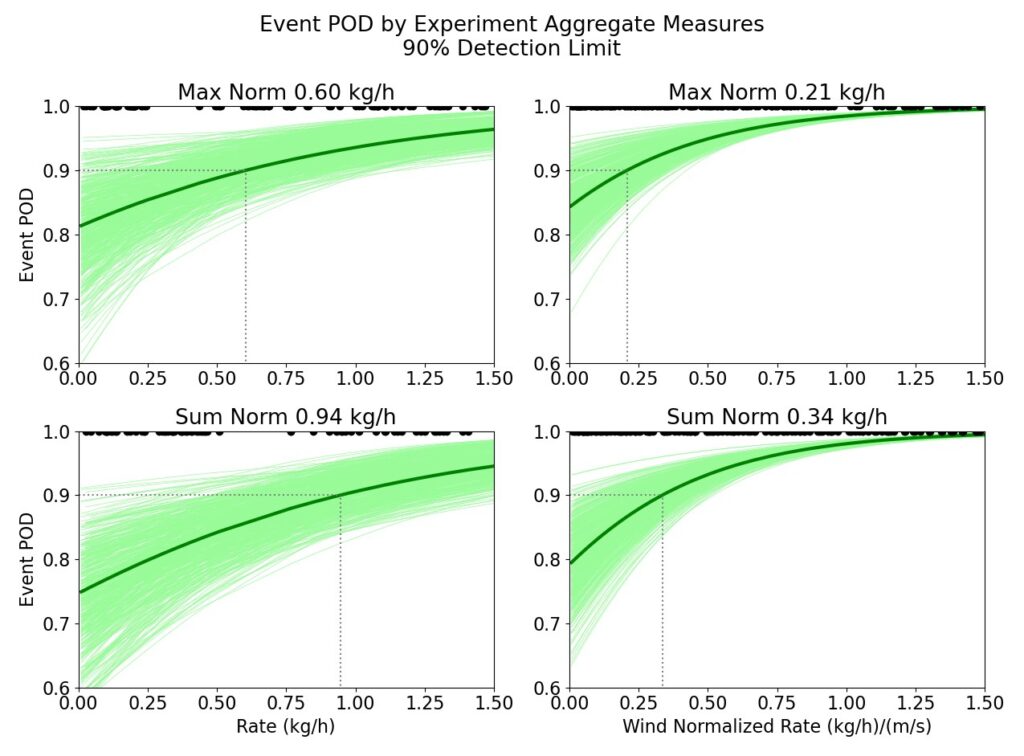
Figure 1 shows an emissions rate detection threshold well under 1.0 (kg/hr) or (kg/hr)/(m/s) for leak rates computed as maximums (top) and sum-of-sources (bottom). As expected, the maximum rate results our system’s minimum possible detection rate. We assume that detection at the event level strongly depends on leak rate because our sensor array surrounds all possible release points. This assumption underlies our use of logistic regression over leak rates to characterize performance at the site/event level. We thus postulate from our extensive experience and operator feedback that this point of view provides a reliable lower detection bound when our system is used in the response cycle at actual facilities. In fact, our sensing arrays are designed to surround a site and provide spatial coverage that best captures site events regardless of the internal configuration of emissions points. Thus, our system is demonstrably reliable (high detection rate) and robust (for a low leak rate) for site/event level emissions detection.
It is important to note that we are considering our sensing arrays independently from the quantification processing in this analysis. However, baseline event detection and reliable alerting from a well-configured set of measurements are foundational as an input to the processing sequence that results in localization and quantification of emissions over a given event. Lastly, as this analysis presents performance relative to aggregated emissions, it can be interpreted as a “downscaled” representation that effectively indicates the occurrence of a significant event and its apparent magnitude. By contrast, a localization and quantification scheme is an “upscaling” procedure that seeks to find the finer emissions structure for the same event and attempt to localize each individual source point. In a subsequent document, we will discuss the design and construction of such a quantification system based on continuous monitoring.

Figure 1, Event probability of detection (EPOD) by aggregated experiment measures for each event cluster of sources. The bold green line shows the mean performance curve. The dotted lines show the leak rate corresponding to a 90% detection rate from the mean of all experiments.


